Introducing jupyter-lab
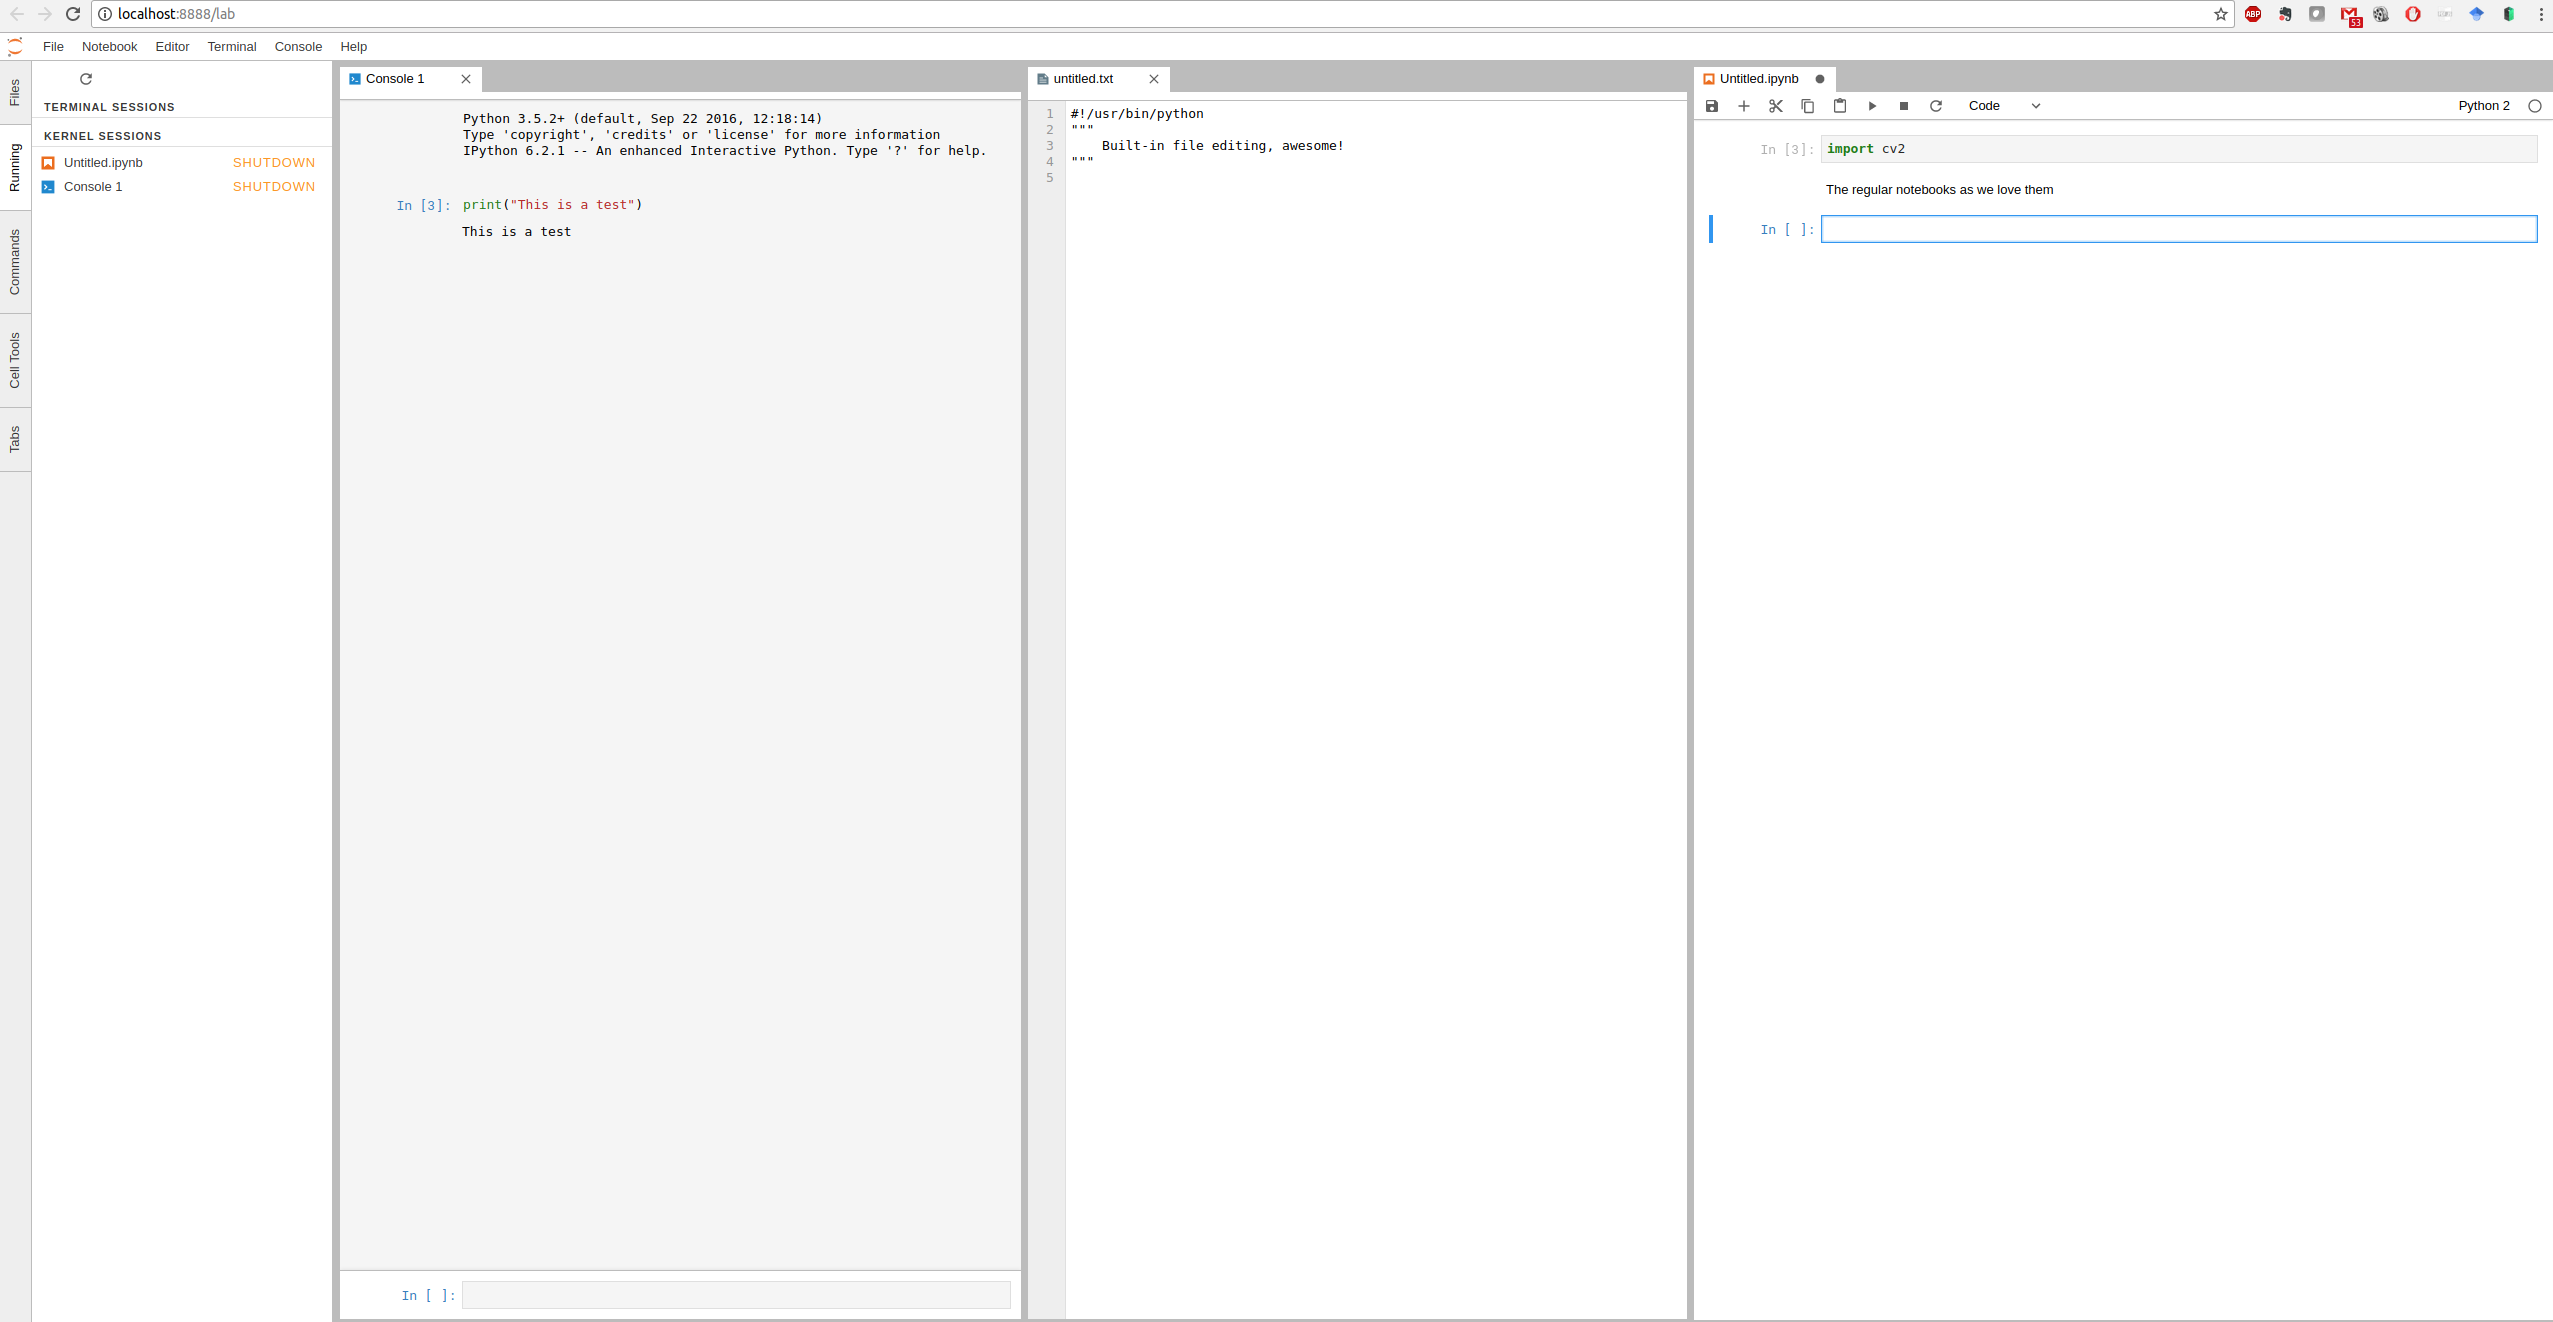
Vim is all fun and games, but for interactivity, storytelling and presenting, or just interactive prototyping, nothing beets jupyter notebooks. Some fine guys have taken it one step further and introduced jupyter lab, which is a wrapper around our beloved notebooks. It offers easier kernel-selection, multi-window notebooks, built-in python consoles and some more.
Autoformatting Python Code
Sometimes, a lot of authors, editors and OSs mess up the indentations and style-conventions of your files.
Here is a astyle substitute for python-code: https://pypi.python.org/pypi/autopep8 (sudo pip install autopep8)
autopep8 --in-place --aggressive --aggressive <filename>
Vim and Python
Put this modeline either in one of the first or last five lines of your python file:
# vim: tabstop=8 expandtab shiftwidth=4 softtabstop=4
and put
set modeline
in your ~/.vimrc file.
Running Python Scripts
I still see a lot of students running python scripts like this:
python myscript.py
In linux, we can make use of the shebang. This line, which has to be the very first line in your script, tells your system what program to use to run your script.
In case of python, this is a simple
#!/usr/bin/env python
followed by a
chmod +x myscript.py
Now you are able to start the python script just like any other executable to run it:
./myscript.py
.
I know, it only saves one word, but nevertheless I find it more convenient and wanted to share it with you.

Neueste Kommentare